The following post is subject to change as concepts are revised and remodeled and new ideas introduced. I am currently working on adding more to the sections of this thread from concepts, models, and systems I have on paper.
-------------------------------------------------------------------------------------------------------Before we get into the gist of it, here is a list of most of the conceptualized variables and their effects on other variables for reference.

NOTE: For the effects of Revolt Risk, the green lettering should say "
Decreases chance of revolt risk"
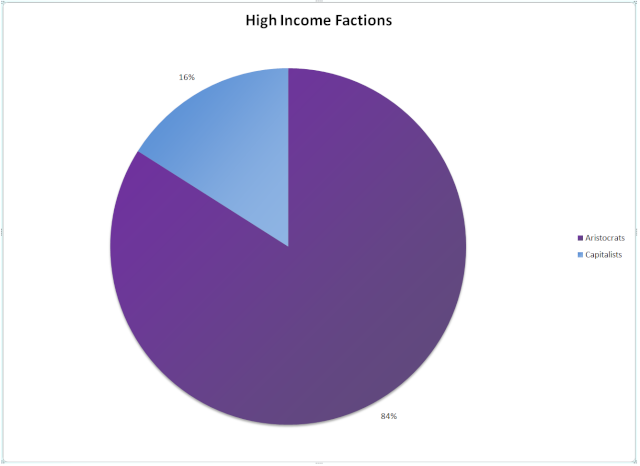
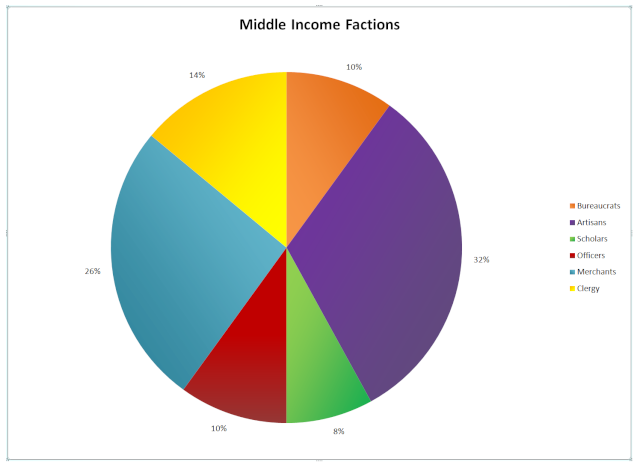
Social Classeshttps://thrivegame.canadaboard.net/t872-societal-structureEvery nation has a unique variety of populations, each with their own demands and outputs, each with their own lifestyles and expectations, and each with their own interactions with the others. In Ancient Rome, there were the plebeians and the patricians, the equites and the slaves. In Revolutionary France, distinct divisions had arisen between the Proletariat, the Aristocrats, the Clergy, and the Bourgeoisie. Even today, there are Executives and Fringes, White Collars and Blue Collars. All of this social class and stratification will be simulated in Thrive. The population of your country will be divided into different social classes and factions. There are three social classes; High Income, Middle Income, and Low Income. All factions belong to one of these classes. Which class a faction is in determines the relative size of the faction, their demand for goods, and their average income. All factions begin by default in a certain Social Class, however, each and every faction can rise or drop a class as a result of policies, events, and other such things. The player sets three individual tax rates for each social class, and a fourth tax on businesses. The list of factions is as follows, grouped according to the default Social Classes.
High Income: Aristocrats, Capitalists
Middle Income: Merchants, Officers, Clergy, Bureaucrats, Artisans, Scholars
Low Income: Labourers, Soldiers, Farmers, Craftsmen, Slaves
The following chart shows all the different incomes a faction can have. Each value is the income of one member of that faction, when employed. Employment does not necessarily mean operation of a building, and will be discussed in further detail below. To determine the overall income of a faction, you must first count the number of members of that faction. Next, you multiply that by the manpower percentage, aka the percentage of able bodied individuals who can work, thus providing the manpower of the faction. Lastly, you count the number of manpower that is employed, thus providing the employed manpower of the faction. This final result, the employed manpower, is the workforce of that faction. The employed manpower is multiplied by whichever income the faction currently has (listed below), and that finally determines the total income of that faction. This is also referred to as the taxable income, because this is the pool of money income tax is collected from. The bolded numbers are the default incomes for a member of each faction.

The player will have several charts available to him/her to display important details regarding the different factions and social classes. The first type of pie chart would display the faction that compose each social class. Other charts would include the percentage of the population of a faction, social class, or your nation that is available as manpower; the percentage of manpower of a faction, social class, or your nation that is employed; and a comparison chart of the total incomes of all the different factions. All these different data sets would provide the player a clear tool for understanding his economy and will give him/her the ability to competently manage its workings.


There are several differences between the different social classes. In regards to consumption, each social class has its own rate. The middle income class's demand for goods is 1x, high income 2x, and low income 0.5x. This means that if the middle income has a demand of 1 ton of bread/person, then the high income class has a demand of 2 tons/person and the low income one of 0.5 tons/person. Due to this, low income classes are the easiest to satisfy and high income are the hardest. Poorer nations will have a larger low income class as their economy would lack the ability to maintain a larger high or middle income class. Economies also normally require large numbers of manpower from faction that start by default in the low income class, therefore societies would naturally shift to form a low income majority, a small or moderate middle class, and a high income minority.
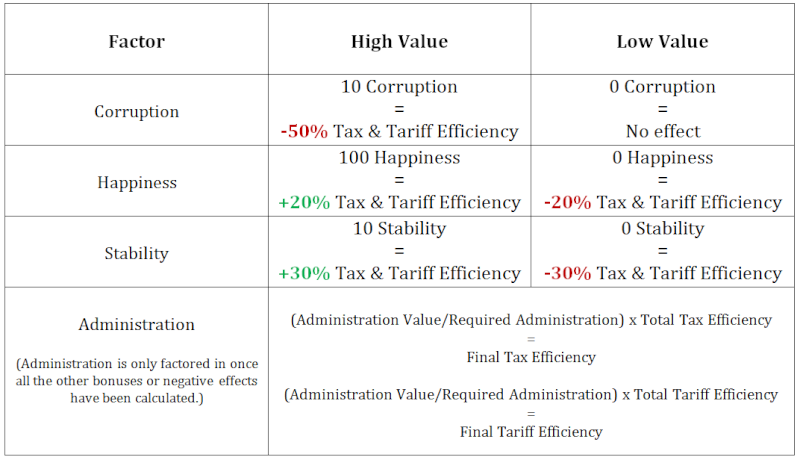
Taxes & TariffsTaxes and tariffs are the player's largest source of income. They are collected on everything from the income of the farmers to the transactions of your merchants. The rate you set for both your taxes and your tariffs determine affect several factors. Primarily, not all of your taxes and/or tariffs make it though to the treasury. Tax and tariff efficiency are two rates that determine what percentage of each is actually deposited into your coffers. Your expected taxes are multiplied by the tax efficiency rate, and the result is how much you actually recieve. It is the same for tariffs. Below there is a table that displays all the values that affect tax and tariff efficiency.

NOTE: The right columns of the table should say Highest Value and Lowest Value. Using these, equations can be made to determine the affect of any value within that range on Tax and Tariff Efficiency.
Your taxes are collected on the employed manpower of each faction. Employed manpower is explained below. The employed manpower of each faction is multiplied by the corresponding income, as explained in the first table. This result is the total income of that faction. Your tax rate is applied onto this.
Population x Manpower Rate (%) = Manpower
Manpower - Unemployed Manpower = Employed Manpower
Employed Manpower x Income = Total Income
Total Income x (Tax Rate x Tax Efficiency) =
Tax Income -----------
The effects of taxation & employment can be seen in the tables below.

 Employment
Employment, in the context of Thrive, has various meanings. Its definition, most basically put, is when the target individual or group are operating an appropriate building, trade route, or simply receiving their daily demands. However, this does not apply to the entire population of a faction. As mentioned above, only a certain portion of a faction is able to operate in the workforce. This is represented by the manpower rate. The manpower rate, a certain percentage, is multiplied by the population of the faction to determine the number of able bodied individuals amongst the population. The manpower rate cannot exceed 80%, and any further bonuses to it simply stack on top of this. This means that of a population of 100 people, the maximum number of them that could partake in the workforce is 80. Now, as also mentioned above, a population's manpower is not always entirely employed. There may be more roles for them to fill than there is manpower to fill it, or it might likewise be the opposite, where there is far more manpower than is needed. These both result either in unemployment or underemployment, and thus managing the population of your nation becomes an important issue to deal with.

For each faction, there is a unique manner in which they are employed.
Slaves: Operate any roles normally filled by a labourer, farmer, or craftsman, but only at a 2:1 ratio. Do not generate income, and thus do not pay taxes. Have no demand for goods. Increase revolt risk by +0.1%/100 slaves.
Labourers: Operate buildings that either intake or produce raw materials (raw materials being resources taken directly from the environment that have not yet been refined). Increase production by +1/100 labourers.
Farmers: Operate buildings that harvest food from the environment.
Soldiers: Recruited as military units.
Craftsmen: Operate buildings that neither intake or produce raw materials.
-----------
Artisans: Do not operate buildings. Generate +1 culture/100 artisans when demands are met.
Scholars: Do not operate buildings. Generate +1 science/100 scholars when demands are met.
Officers: Recruited as military units in leadership roles.
Bureaucrats: Operate state buildings. Operate management roles in factories employing 100 people or more. Every 100 people require 1 bureaucrat for management. Increase Administration by +1/100 bureaucrats.
Clergy: Operate religious buildings. (Increase stability based off of the percentage of the population they compose?)
Merchants: Operate trade routes based off of largest shipment traded through. (If taking 5 tons of wheat to a city then returning with 1 ton of coal, the trade route requires 5 merchants.)
-----------
Aristocrats: Do not operate buildings. Increase influence by +1/100 aristocrats.
Capitalists: Do not operate buildings. Under high economic freedoms and low taxes will privately build new factories.
Supply-Demandhttps://thrivegame.canadaboard.net/t868-supply-and-demand-model(Thanks to Sciocont for the following model. This is copied from the link more or less word for word.)
-----------
So we need to figure out how exactly to price a good depending on supply first, then determine the effect that demand has on it.
If there is excess supply, price drops, if there is too little supply, price increases. This means we need to determine what an expected supply is. Let's keep it simple, and use your example of lumber. If you get 10 tons of lumber per 100 terrain tiles of forest per year, and you have 250 terrain tiles being harvested, you'll be getting an expected 25 tons per year. If you produce 27 tons, that's surplus, so price goes down. This can be represented by a simple equation, I'll try to use as many of your variables as possible
V=B(E/A)
V=actual price (value) of product
B=Base price of product
E=Expected supply of product
A=actual supply of product
Again, the base price is 100 credits/ton.
V=100 credits/ton(25 tons expected/27 tons expected)
V=92.6 credits/ton
That should take care of supply. Demand is another thing. Let's assume that base demand is that every unit is sold (or used by the seller) every year of the actual supply, and that every year all of it is purchased at once from all of the potential buyers. If the demand of all of the potential buyers is greater than the total supply, price goes up. If demand is less, price goes down.
q=selling price of product
V=actual price of product
D=expected demand
G=actual demand
r=generated random number
q=rV(G
2/D
2)
This (G
2/A
2) means that price increases exponentially with more demand, which makes sense, because the seller wants to make as much money as possible, and only has a limited supply.
We've generated
r=.0134
The actual demand is your 10 tons, plus 5 tons from the producer, 7 tons from another country, 4 tons from another country, and 3 tons from another country. This is 29 tons total.
q=1.0134(92.6 credits/ton)(29 tons
2/27 tons
2)
q=1.0134(92.6)(841/729)
q=1.0134(92.6)(1.15)
q=108.3 credits/ton final price
If we replace "B x (d/s)" with "q" in your equation, we get
f = t x (q + T)
So in this version, the final price of wood for you would be 141.1 credits/ton, costing you 1411 credits for 10 tons
However, I have another problem with this now. Tariff shouldn't multiply the transport cost, since it taxes the fact that you are transporting it, not how far you're transporting it. So the equation should be, in my eyes
f = tq + T
Meaning that the cost would be 139.1 credits/ton instead.
-----------
Tech Object Constructionhttps://thrivegame.canadaboard.net/t867-tech-object-construction-----------
Thanks to gdt1320 for this model.
Inputs: Construction Cost, Production Available
Output: Construction Time
I'm assuming that the production value is limited, and that multiple construction projects will result in less production being available. It'd also help if there was an established range for P, but here is a general form
t = C*(1+z^(-P/C)).
t is the construction time, C is the Construction cost. z is an arbitrary value (preferably between 1 and 2)
For this function as P gets really large, the base cost will always be close to C. It also has a scale effect so that projects that cost more will always take more time. The max build time for a really small P is 2*C.
This function can also be used to find a maximum P_a at which increasing P further has little effect on the construction time. This P_a can be considered the maximum P that can be put toward this project.
So for example lets say a 0.1% decrease on C is considered negligible.
z^(-P_a/C)=0.001
you can take log of both sides and get
P_a = 3*C/(log z), and that will be the amount of Production that the project takes.
-----------
Capitalshttps://thrivegame.canadaboard.net/t857-types-of-capitalsMore detail coming soon.
Political Capital: +1 Admin, Sets as Nation Capital, + Influence
Manufacturing Capital: +20% Production
Financial Capital:
Technological Capital: +20% Science
Cultural Capital: +20% Culture
Administration & Corruptionhttps://thrivegame.canadaboard.net/t874-administrationAdministration is a value that represents the player's nation's capability and efficiency of ruling all of it's peoples and cities. Nations with efficient, meritocratic governments, high numbers of bureaucrats, high stability and happiness, and a small population require less administration. Tribal, backwards governments, low numbers of bureaucrats, high levels of corruption, low stability and unhappiness, and a large population requires more administration. Administration is only unlocked once you discover Socialisation. Before that, it is not a value that shows up anywhere on the screen and you do not need to worry about it. Socialisation unlocks administration and on its own provides +1 administration point. 1 administration point at this stage allows you to efficiently govern up to 100 people. Anything more and negative effects start to kick in. Next thing to give more admin (administration) is communities, which gives +1 point of admin, allowing up to 200 people to be governed efficiently without negative effect. Bureaucrats increase admin by +1/100 bureaucrats.
Early Society gives an additional +1 admin point.
Early Government is a major milestone. It does not give any additional admin points, but instead changes the rate of administration. Now, 1 point allows efficient governance of 1000 people. So, if you had already researched all three of the above mentioned techs, then you discovered Early Government, your max population that you could govern efficiently would jump from 300 to 3000.
Ok, so we need two new techs, Colonialism, and Imperialism. Now, if my memory serves me right, I remember reading somewhere that new SC's must be founded within a certain range of existing ones. However, the tech Colonialism would unlock the ability to found SC's at a much greater distance, but they would have limited growth, or some other limitations to represent their colonial status. Colonialism would also give a boost to Admin. Colonialism would lead to the next tech on my list, Imperialism. Imperialism changes the rate of Admin from 1000 people/point to 10,000 people/point. This is to simulate the massive colonial empires' growing control over large numbers of people. To reference to an example of this in real life, the British Empire at its peak held nearly 20% of the world's population within its borders, and quite efficiently. However, 200 years before it had been struggling simply to rule England itself, let alone a massive colonial empire. The only reason they could've made this jump is through a massive boost to administration. Changing the rate of administration would simulate this.
CultureCultural Themes:Honour
Love
Liberty
Patronage
Wisdom
Order
Unity
Stewardship
More details coming soon.
-------------------------------------------------------------------------------------------------------

 by
by 


